Ocean pH is still above 7 (basic) — but it is becoming less basic as the sea absorbs CO₂.
—
Off Hawaii
—
more acidic than at the start of the record
Off Bermuda
—
more acidic than at the start of the record
pH trend
—
pH units a decade
CO₂ in the air
—
ppm at Mauna Loa (latest day)
The whole ocean and two stations: the same fall
Surface seawater pH measured off Hawaii and off Bermuda. Dots: each research cruise; lines: yearly averages. Lower pH means more acidic.
Why? The sea follows the air
Carbon dioxide in the air at Mauna Loa, Hawaii, and in the surface water at both stations. The ocean absorbs about 30% of the CO₂ released into the atmosphere, and in seawater it forms carbonic acid (NOAA). The full record of CO₂ in the air since 1958 is on the CO₂ page.
—
Is seawater getting harder for shell builders?
Aragonite saturation, yearly averages. Corals, oysters and pteropods build shells and skeletons from aragonite; the lower the saturation, the harder that is, and below 1 the mineral starts to dissolve.
Ocean pH scale
How much more by the end of the century?
Projected fall in global surface ocean pH from 1870–1899 to 2080–2099 (IPCC AR6, from climate models).
What does acidification do to life?
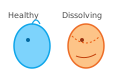
Pteropods: severe shell dissolution in these tiny sea snails has been found in the Southern Ocean (NOAA).
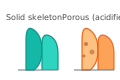
Corals: skeleton formation slows as aragonite becomes harder to pull from seawater.
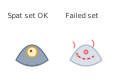
Oyster hatcheries: at an Oregon hatchery, oyster larvae did worse when the upwelled seawater carried more CO₂ (Barton et al. 2012).
What drives this
CO₂ in the air →The ocean takes up part of the CO₂ we emit; the more there is in the air, the more dissolves.
Ocean heat →Warming and chemistry interact: heat stresses ecosystems while CO₂ changes carbonate balance.
What this drives
Coral bleaching →Acidification weakens reef building while heat drives bleaching.
Food systems →Shellfish and fisheries are part of the same climate-food risk chain.
How we know this
Source: the whole-ocean average from the E.U. Copernicus Marine Service (global ocean acidification indicator, CEA/LSCE); Hawaii Ocean Time-series surface CO₂ data from Station ALOHA (J.E. Dore, University of Hawaiʻi; Dore et al. 2009); Bermuda Atlantic Time-series Study bottle data (N.R. Bates, R.J. Johnson and others, published by BCO-DMO, CC BY 4.0); NOAA GML Mauna Loa CO₂; projections from IPCC AR6.
Update cadence: CO₂ in the air is downloaded every night. The ocean files are updated once or twice a year; we check both every night.
Time coverage: the whole ocean yearly since 1985; Station ALOHA since October 1988 and Bermuda since October 1991, both about monthly; CO₂ in the air shown from 1988.
Methods: Both teams measure the carbon dissolved in seawater and its alkalinity. The Hawaii team calculates pH at sea temperature, CO₂ pressure and aragonite saturation from them and publishes the results. Bermuda publishes the measurements only, so we do the same calculation with the same settings. Run on Hawaii’s measurements, our calculation gives Hawaii’s published pH to within 0.0005 on all 346 cruises with complete data. For Bermuda we average the good-quality bottles from the top 30 m of each monthly cruise. Trends are straight-line fits over all cruises; “more acidic” is read off that line at the first and last cruise.
Checked against the source: Our straight-line fit to the whole-ocean average gives −0.017 pH units a decade for 1985–2025; Copernicus states −0.0017 a year since 1985. Two versions of the Copernicus series (to 2024 and to 2025) agree within 0.0003 in every year they share. Our Bermuda trend is −0.020 pH units a decade for 1991–2025. The Bermuda team reports −0.019 a decade since 1983 (Bates and Johnson 2020).
Uncertainty: The whole-ocean figure is an estimate: ships have measured CO₂ in only part of the ocean, and a statistical model fills the gaps (Copernicus gives about ±0.015 pH for each year’s level; the trend is far more certain than that). The two stations are both in warm, open, subtropical water. Coastal waters, upwelling regions and polar seas acidify differently.
Limitations: The ocean is still basic (pH above 7); “acidification” means it is becoming less basic. Seawater CO₂ is in microatmospheres and air CO₂ in parts per million; at the sea surface the two scales differ by a few per cent. Impact icons are illustrations.